Tips to explore a codebase
Getting to know a codebase
I newly joined a team on a project that has been live for a few years already. For that reason, I had to get to know my way around a pretty complex and big codebase in a short amount of time.
It’s always very time consuming to figure out which class is responsible for what, what subclass of UIViewController is displayed, etc. It can be overwhelming and we don’t always have the tools or techniques to explore a codebase without constantly bothering our team members.
I would like to share a few tips that allowed me to efficiently get familiar with a new codebase in a short amount of time!
Symbolic breakpoint 🧐
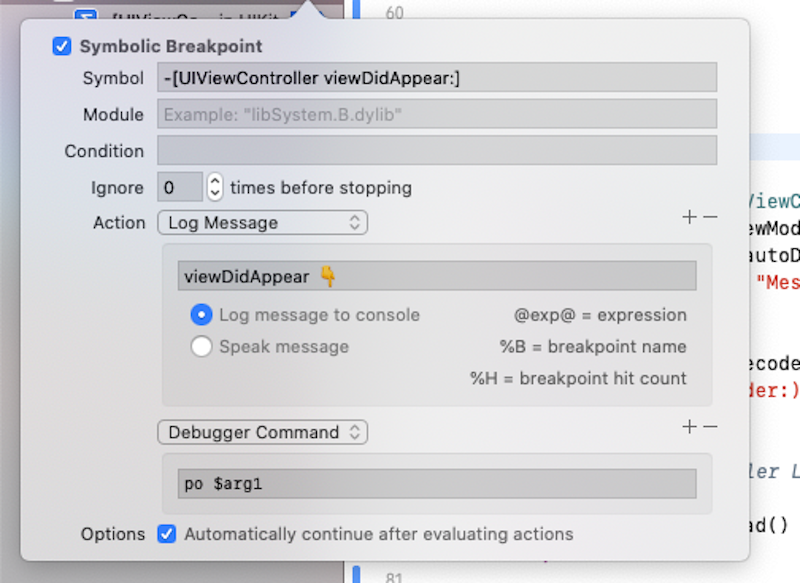
Symbolic breakpoint allows setting a breakpoint based on a symbol like a method or function name, regardless of where that name might appear in the code.
With that in mind, we can use a symbolic breakpoint to print out the name of a subclass of UIViewController every time it triggers viewDidAppear. This allows us to know which UIViewController is currently displayed.
- Go to the Breakpoint Navigator
- Select the + symbol at the bottom of the screen
- Choose Symbolic breakpoint…
- Add the following:
Call stack 📚
While your app is running, it stores information about what it’s dong in a call stack. You can view that call stack in the Debug Navigator by stopping your app with a breakpoint.
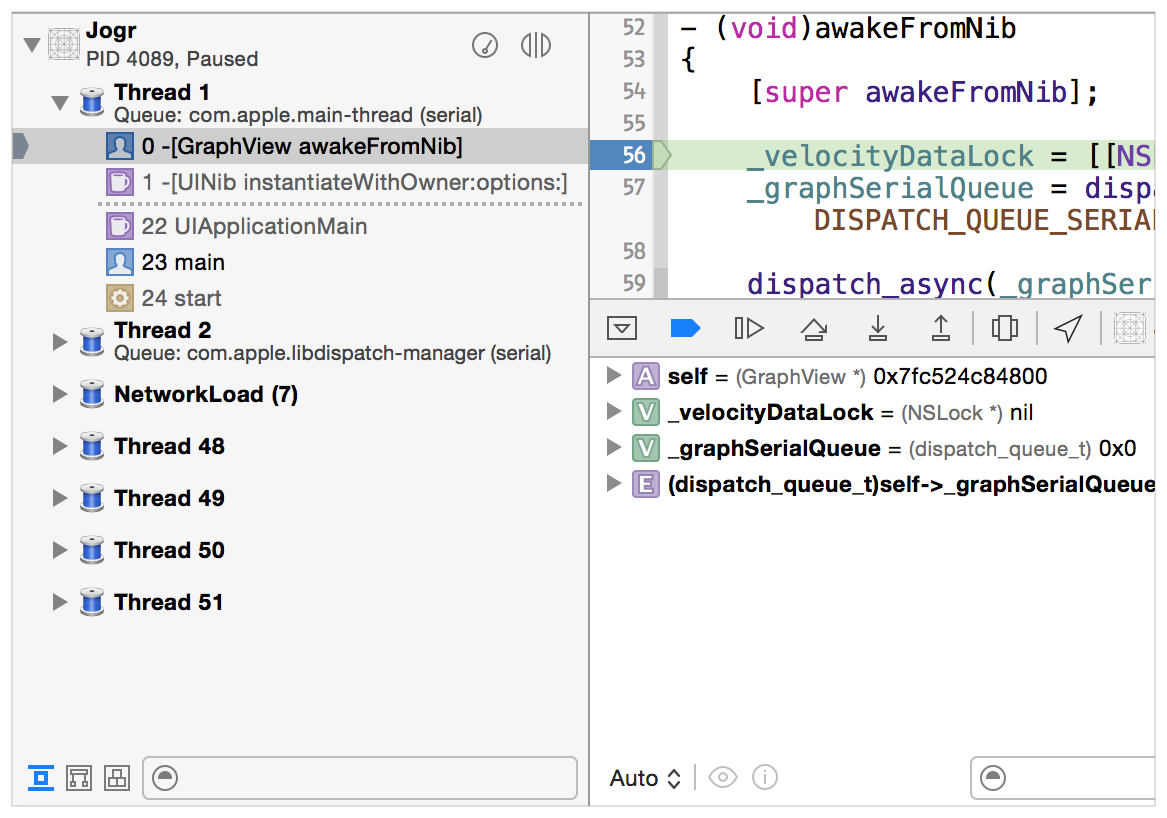
This allows you to check the behavior of a method and how it interacts with other parts of your app. For example, you might want to figure out why and where a specific method was called.
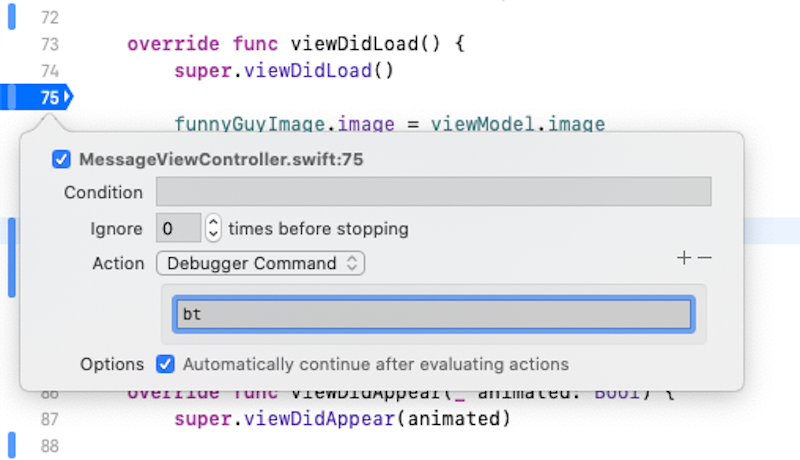
Alternatively, you can also use a breakpoint action that will print out the call stack without pausing the app.
Debug view hierarchy 🔍
In most projects, you will find subclasses of UIView, UICollectionViewCell, UIViewController and many more. While exploring a big codebase, it’s not always easy to figure out where, when and how those subclasses are being used. One thing that really helped me is the Debug View Hierarchy in Xcode.
To use it, while your app is running, click on  .
Xcode will open the Debug View Hierarchy like so:
.
Xcode will open the Debug View Hierarchy like so:
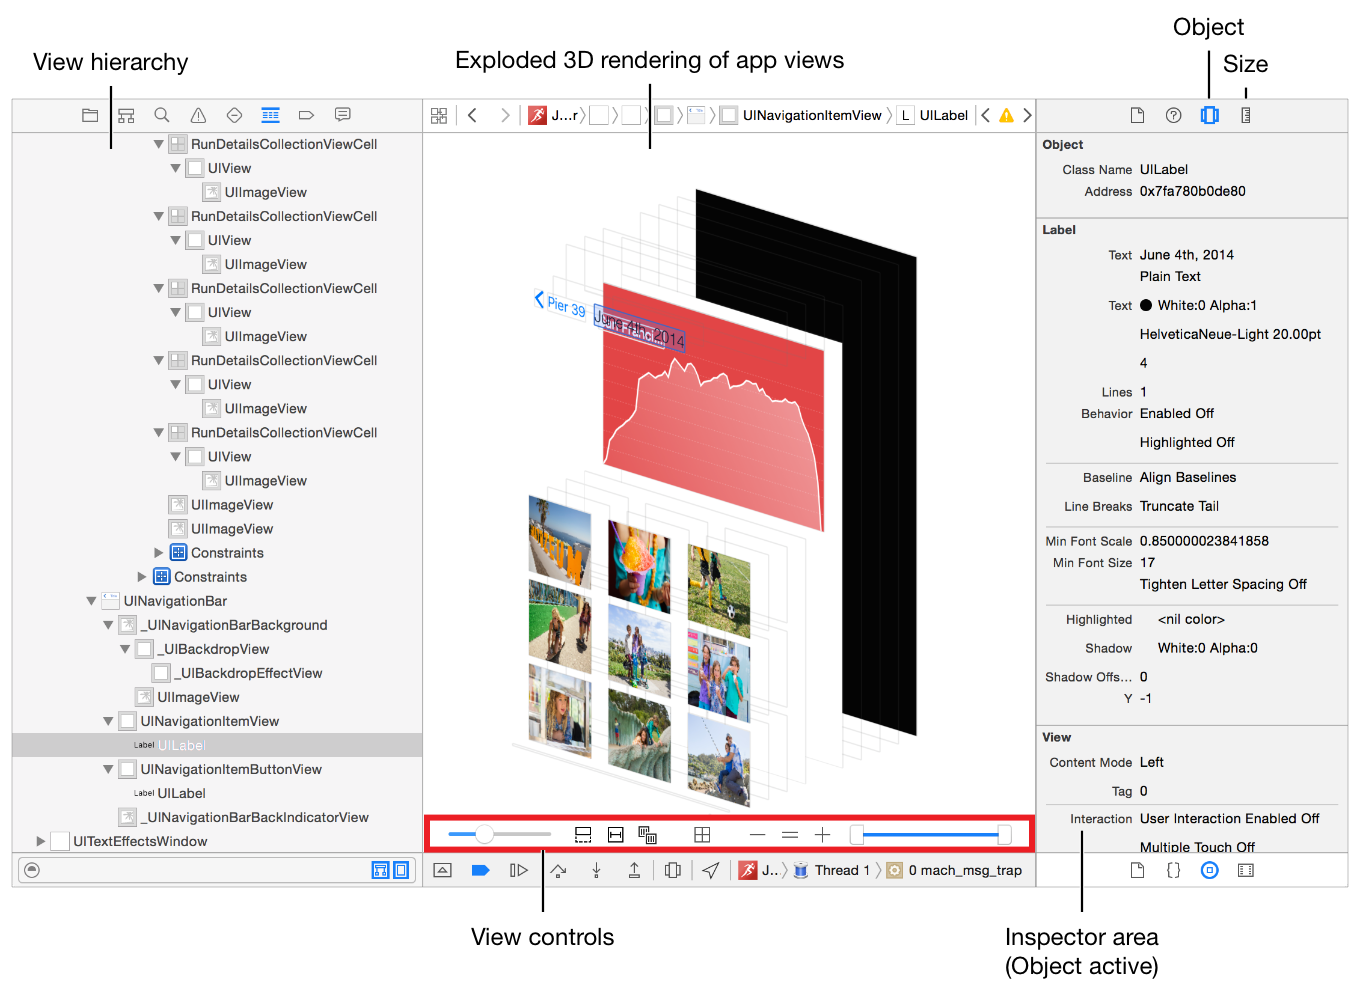
and you will be able to easily identify subclasses and inspect the navigation stack of your app.
Shortcuts 🚀
There are a few shortcuts built-in Xcode that are very useful to explore a codebase.
Cmd + click on a symbol will open a menu with different options.
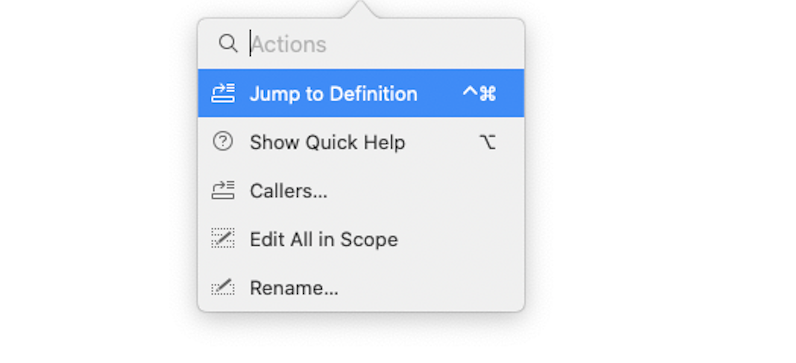
-
Jump to definition will jump to the source or header of the selected symbol.
-
Callers will show you all the files where that symbol is used.
Also, you can use Cmd + Shift + j from any file to reveal it in the Project Navigator.